“Is the water hard here?” is the most common water question in Australia, and the answer is usually given at the wrong scale. Hardness is not a city property. It varies by supply zone within a single metro, sometimes by a factor of eight.
The national guideline makes the practical stakes clear. To minimise scale build-up in hot water systems, total hardness should not exceed 200 mg/L — and above that level, the guidelines warn of “excessive scaling of pipes and fittings” and “blockage of safety relief valves in hot water systems”.
What the guideline actually says
Hardness is classified as an aesthetic parameter, not a health one. The ADWG bands are: below 60 mg/L, “soft but possibly corrosive”; 60–200 mg/L, “good quality”; 200–500 mg/L, “increasing scaling problems”; above 500 mg/L, “severe scaling”.
That first band is worth sitting with. The same guidance notes that soft water may lead to greater corrosion of pipes, depending on pH, alkalinity and dissolved oxygen — so low hardness is not automatically “better”, it moves the problem from scale to corrosion.
Nationally, hardness in major reticulated supplies ranges from about 5 mg/L to about 380 mg/L.
The Perth data, locality by locality
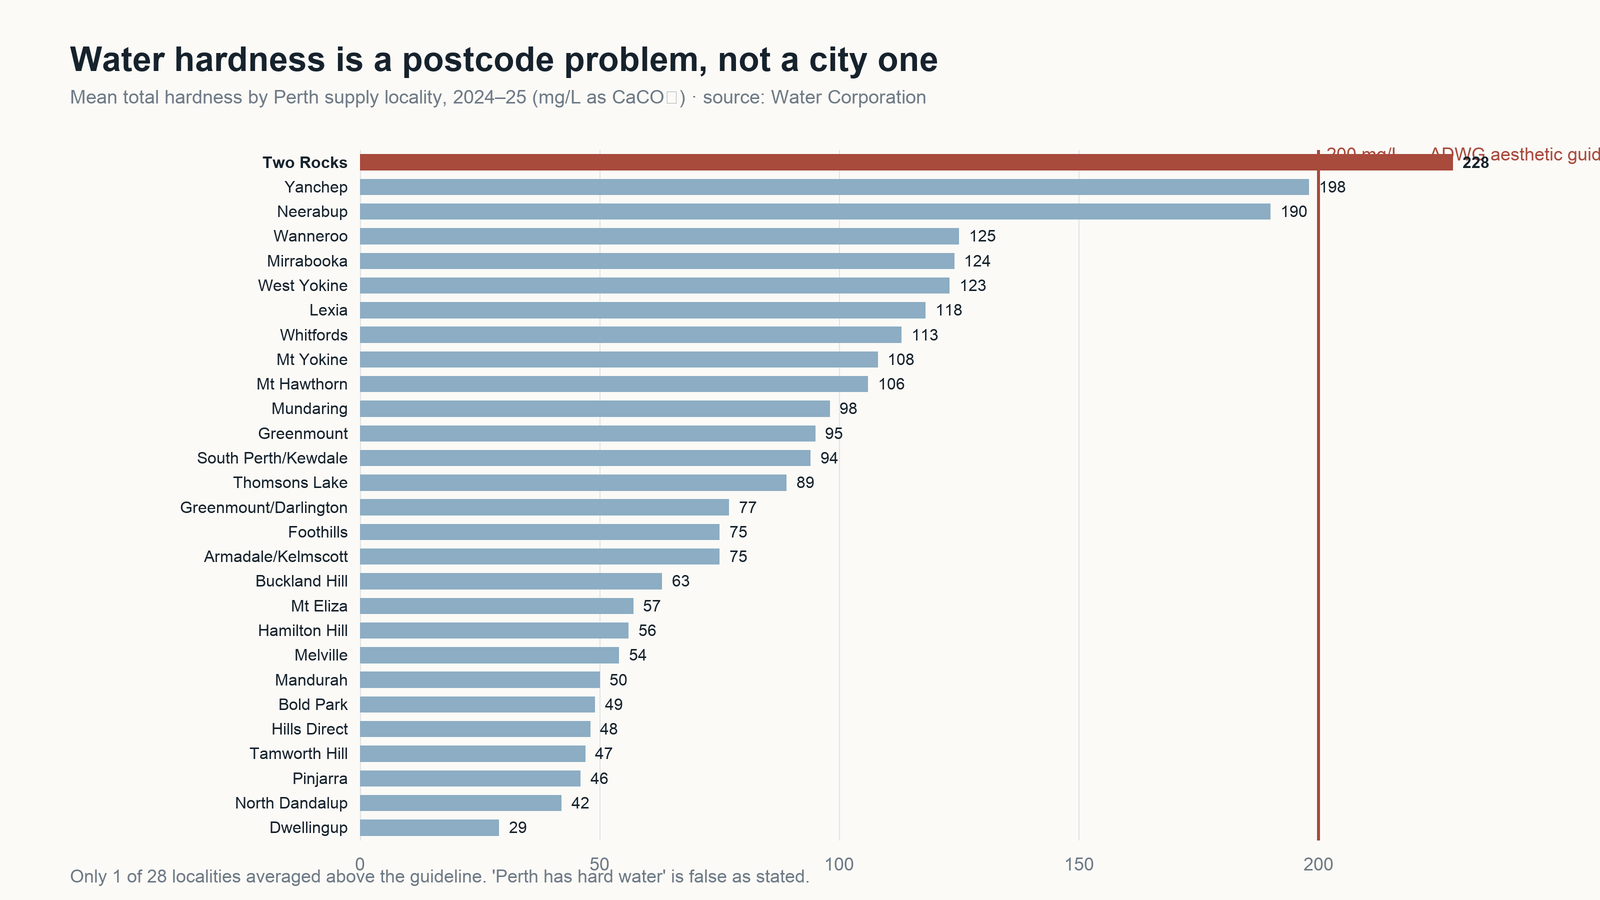
Water Corporation publishes annual means for 28 Perth supply localities. In 2024–25 they ran from 29 mg/L at Dwellingup and 42 mg/L at North Dandalup up to 228 mg/L at Two Rocks — the only locality to average above the guideline, with samples between 220 and 240 mg/L. The utility footnotes it plainly: “Elevated hardness is characteristic of the source supplying this locality.”
Yanchep (198 mg/L) and Neerabup (190 mg/L) sat just under the line. Most of the metro was far lower: Mandurah 50, Bold Park 49, Tamworth Hill 47, Pinjarra 46.
So “Perth has hard water” is false as stated. Hardness is a supply-zone issue, and the fix is knowing your zone.
Why the spread exists
Perth’s Integrated Water Supply Scheme in 2024–25 was 41.5% desalinated seawater, 43.6% groundwater and 13.8% surface water. Groundwater is where the minerals come from, and the utility operates crystallisation softening at the Neerabup groundwater treatment plant specifically to reduce hardness — which is why Neerabup’s delivered water sits at 190 mg/L rather than higher.
Source mix is therefore also why hardness changes over time. As the mix shifts, so does your kettle.
The other end of the country
Sydney Water reports per delivery system rather than citywide, which is the honest way to do it. For the Ryde system in 2025–26 the annual average total hardness was 52.5 mg/L across 28 samples, with a typical range of 46–58 mg/L, well under the 200 mg/L guideline and compliant.
Ryde is not “Sydney” — quoting it as a city figure would repeat the same error in the other direction.
What households actually notice
The utility’s own consumer framing: hard water “requires more soap to obtain lather and can also cause scale to form on hot water pipes and fittings”, and “can also be an important issue to consider when purchasing appliances, such as dishwashers”.
Practically: kettle scale, shower glass, and hot-water system efficiency are the visible costs. A salt-free descaler changes how scale behaves rather than removing minerals; a conventional ion-exchange softener actually removes calcium and magnesium but needs salt and maintenance. They are different products and should not be sold as interchangeable.
Shower filters · Whole house systems
Reading note: “hard” is not a standardised word across jurisdictions, so figures here are quoted in mg/L rather than adjectives. We could not verify primary utility figures for Adelaide or Melbourne and have therefore not printed them. And where a single city quote appears, it refers to one delivery system, not the whole city.
Sources
- NHMRC, Australian Drinking Water Guidelines — Hardness (aesthetic) fact sheet — guidelines.nhmrc.gov.au
- Water Corporation, Drinking Water Quality Annual Report 2024–25 (PDF, Table 4 p.61; source mix p.16; softening p.29) — watercorporation.com.au
- Sydney Water, Quarterly Drinking Water Quality Report — Ryde Delivery System, Q4 FY2025-26 (PDF) — sydneywater.com.au