South Africa Loses About a Quarter of Its Treated Water Before It Reaches a Tap

South Africa’s water problem is usually described as a supply problem. The regulator’s own data describes something more awkward: utilities bill for barely half the water they treat, and roughly a quarter of it is physically lost through leaking pipes — while a large share of what does arrive is flagged for microbiological risk.

The distinction is not pedantic. “Non-revenue water” bundles two very different things: water lost to leaks, and water that is delivered but never billed — including free basic water and unmetered use. Confusing the two turns a billing and leakage story into a false claim that half the country’s taps are dry.

Bar chart of South Africa's drinking-water risk profile: low-risk systems 60.2% to 61.9%, critical-risk 9.9% to 7.9%
Blue Drop 2025 progress assessment: share of assessed systems by risk band. Source: Parliament of South Africa / SAHRC.

That distinction matters if you are deciding what to put under your sink. You are not filtering a single, fixed contaminant. You are managing variability: water that is compliant one week and discoloured the next, depending on which reservoir was drawn down or which main burst overnight.

What the government’s own assessment says

The Blue Drop progress report for the 2025 assessment cycle, released on 31 March 2026, showed a marginal improvement: low-risk systems rose from 60.2% to 61.9%, and critical-risk systems fell from 9.9% to 7.9%. In other words, roughly one system in five remains in high- or critical-risk territory.

The South African Human Rights Commission, reading the same assessment, is blunter about where the risk sits. It reports 10.5% of assessed systems in the high-risk category and 7.9% in critical, and that 49% of water supply systems received a high-risk microbiological quality rating. The Northern Cape and Free State carry the largest share of high- and critical-risk systems.

Microbiological risk is a different problem from the sediment or chlorine taste most household filters address. It is also the one a filter is least likely to solve on its own, and we will come back to that.

Roughly half the treated water never arrives

National non-revenue water — treated water that is lost or unbilled — was 47.4% in 2023 and 47.3% in 2025, against an international average of about 30%. Parliament’s water committee described this as “a system that remains in crisis”.

Johannesburg makes the arithmetic concrete. In a ministerial reply (NW4784, 4 September 2026), non-revenue water for 2025/26 — un-audited — was 47.1%, or 295,146,398 kilolitres. Of that, physical losses were 157,359,208 kL (about R2.4 billion), commercial losses 61,195,247 kL (about R939 million), and unbilled authorised consumption 76,591,943 kL (about R1.17 billion) — that last tranche is water that did reach a tap. Against total supply of roughly 627 million kL, physical loss works out at about a quarter. The City’s infrastructure maintenance backlog is estimated at R9.1 billion.

None of that is a water-quality number. It is a pipe-and-money number. But it explains the texture of day-to-day experience: pressure drops, intermittent supply, air in the lines, and sediment pushed into household plumbing when a main is repaired and recommissioned.

Wastewater is going the wrong way

Wastewater treatment feeds the raw water sources that drinking-water plants draw from, so it is a leading indicator. Green Drop 2025 found systems in a “critical state” rose from 39% (334 systems) in 2022 to 47% (396 systems) in 2025. Systems rated “excellent or good” fell from 14% (118) to 8% (66), and Green Drop certifications fell from 22 to 14.

The skills picture is equally specific: of 2,431 process controllers required nationally, 1,151 are employed — a 68% shortage in the Free State and 82% in the Northern Cape, plus a shortfall of 84 supervisors.

What households actually notice

Mostly taste and appearance, and often for harmless reasons. In March 2025, Cape Town residents reported an earthy taste and smell. The cause was geosmin, a compound from Theewaterskloof Dam reaching the Faure and Blackheath plants. The City stated the water remained compliant with SANS 241:2015, dosed powdered activated carbon, and noted geosmin is detectable by the human palate at a few parts per trillion.

That is the useful lesson: “compliant” and “pleasant” are different claims. SANS 241 is a health standard, not a taste standard — and a filter’s carbon stage is precisely the part that addresses taste and odour compounds.

When the system genuinely fails, the consequence is acute rather than aesthetic. The 2023 cholera outbreak centred on Hammanskraal in Gauteng and the Free State claimed 24 lives with hundreds hospitalised, and the Presidency linked it to poor water and wastewater management.

It is worth being precise here, because the simplified version of that story circulates widely and is not fully supported: the Water Research Commission’s independent analysis did not find the cholera strain in domestic water sources. So the outbreak is best understood as a failure of water and sanitation management in a specific area, not proof that household taps across the country are contaminated.

So what does a filter actually do?

Layered honestly, for South African conditions:

  • Sediment filtration handles the visible problem — the rust-brown water after a burst main or reservoir draw-down. This is the most under-rated stage and the cheapest.
  • Carbon filtration handles chlorine, taste and odour, including geosmin-type earthy notes. It does not make microbiologically unsafe water safe.
  • Reverse osmosis addresses dissolved contaminants — heavy metals, nitrate, sodium, some industrial chemicals — at the cost of water rejection and slower flow. It is not a microbiological barrier you should rely on by itself.
  • Microbiological risk — the 49% figure above — is a treatment and boiling question first. A sediment or carbon cartridge is not a disinfection step, and no filter marketing should suggest otherwise.

The practical South African configuration for most households is a whole-house sediment and carbon system at the point of entry, which protects appliances and takes the worst of the variability out of every tap, with a drinking-water stage at the kitchen if dissolved contaminants are a specific concern. If your supply is interrupted regularly, a pre-filter ahead of the main system is the usual recommendation, since sediment is what shortens cartridge life.

Whole house systems · Replacement cartridges · Under-sink systems

One caveat on all of the above

These are utility and regulator figures measured at treatment works and reservoirs. Lead, chloramine by-products and biofilm happen in the last metres of your own plumbing, which no national dataset covers. If your building is old, the pipe between the street and the tap is the part nobody is measuring.

Sources

  • Parliament of South Africa, water committee statement on Blue Drop 2025 and non-revenue water — parliament.gov.za
  • South African Human Rights Commission statement on drinking-water risk and wastewater — sahrc.org.za
  • Ministerial reply NW4784 on Johannesburg non-revenue water — pmg.org.za
  • City of Cape Town, earthy taste statement (geosmin, SANS 241) — capetown.gov.za
  • The Presidency on the 2023 cholera outbreak — thepresidency.gov.za
  • Water Research Commission analysis of the Hammanskraal outbreak — sanews.gov.za
Day Zero Never Came. Cape Town Is Back in ‘Drought Response’ Anyway

In early 2018 Cape Town was the first major city in the world to publish a countdown to running out of water. “Day Zero” was a date, it appeared on a website, and it moved. The city never reached it. What is less well known is that the same dashboard, in November 2026, records the metro back in official “Drought Response”.

That is not a rerun of 2018. It is the more ordinary story of a city whose water security now depends on how quickly it builds new supply and how well demand holds.

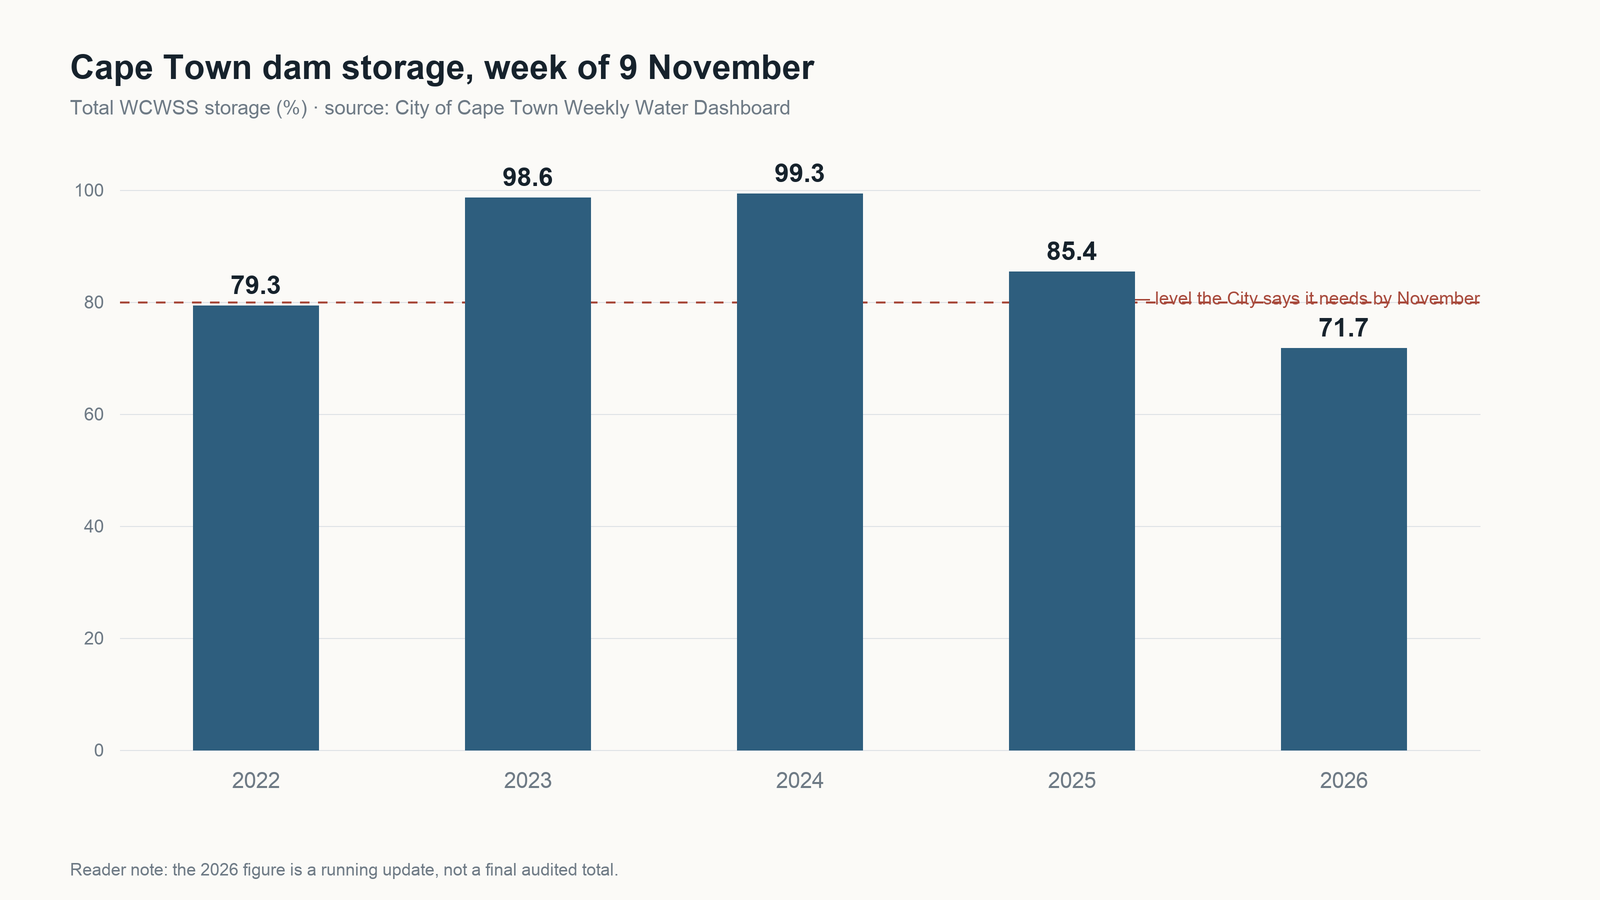
Bar chart of Cape Town total dam storage in the week of 9 November, 2022 to 2026, falling from 99.3% in 2024 to 71.7% in 2026
Total WCWSS storage, week of 9 November each year. Source: City of Cape Town Weekly Water Dashboard, 9 November 2026.

What actually happened in 2018

On 30 January 2018 the City reported dam levels at 26.3% and projected Day Zero for 16 April 2018. Collective use stood at 580 MLD against a 450 MLD target, and Level 6B restrictions — 50 litres per person per day — took effect on 1 February alongside new tariffs.

By 20 February the projection had moved to 9 July 2018, and weekly average demand had fallen to 523 MLD, against 1,130 MLD in 2014. The city’s own account credits an aggressive roll-out of pressure management and water-management devices at high users’ properties.

The recovery was declared on 7 March 2018, with consumption down from over 600 MLD to about 520 MLD. The premier’s explanation at the time named four things: tighter restrictions, significant tariff increases, a deliberate drop in water pressure, and resident compliance — plus agricultural supply to three irrigation boards being cut entirely and a 10,000-megalitre donation from the Groenland Water Users Association.

Day Zero itself was defined as dams reaching 13.5%, at which point rationing at 25 litres per person per day would begin. It was a moving target by the premier’s own description: 21 April, then 12 April, then 16 April, then 11 May, then 9 July — and then not at all.

The attribution is still contested

Academic analysis of the episode argues that demand management had already cut daily consumption by roughly half since 2016, but that the city consistently failed to get below its 500 MLD target, and that Day Zero was averted “primarily by relying on unexpected buffers” — temporary agricultural transfers and private greywater and boreholes in wealthier neighbourhoods. The authors describe the process as “painful and inequitable”.

Both accounts are sourced and they do not fully agree. That matters for planning: a city that believes it solved 2018 with restrictions and tariffs will invest differently from one that believes it was rescued by luck.

The 2026 position, in numbers

The week of 9 November 2026 put total WCWSS storage at 71.7% — 644,353 Ml of 898,221 Ml capacity — after 85.4% in 2025 and 99.3% in 2024. Rainfall since May has been below expectation, storage is about 15% lower than the same time last year, and the City says it is engaging on “the possible need for formal water restrictions”.

Average total daily use is 880 MLD, at 150 litres per person per day (against a 12-month average of about 160). Production splits as 867 MLD from major dams, 1 MLD from minor dams, and 12 MLD from groundwater and springs.

The swing inside a single year is the striking part. Storage was 79.4% on 3 December 2025; by 18 March 2026 it had fallen to 50.4%, with use at 1,058 MLD — 83 MLD over the 975 MLD target. Then one May storm took storage “from around 44% to above 70% in a matter of days”, and by 1 July 2026 it was 74.9%.

Note the City’s own threshold: dams normally need at least 80% by the November Annual Operating Analysis to avoid restrictions imposed by the Department of Water and Sanitation.

What is being built

The City committed R570 million to its New Water Programme in that financial year, targeting 300 MLD by 2036. The timelines have slipped: Berg River–Voëlvlei (40 MLD) is now 2030, Faure water reuse (70 MLD) first water 2031, Paarden Eiland desalination (70 MLD) 2036, with alien-vegetation clearing worth about 30 MLD.

Its August 2026 outlook notes that demand growth exceeded the 1.5% target in 2025/26, which raises restriction risk.

What this means for a household

A system under this kind of stress produces two water-quality symptoms more than any other: sediment when pressure management and intermittent supply disturb the network, and taste and odour when the source mix shifts. A whole-house sediment and carbon stage handles both. If restrictions return, storage tanks become relevant — and stored water needs its own hygiene plan, not just a tank.

Whole house systems · Replacement cartridges

Two reading notes. The “drought or not” question is genuinely contested: the City said on 18 March 2026 that “Cape Town is not in a drought” while its dashboard used “early drought caution” in October 2025 and “Drought Response” in November 2026. And the 2026 figure is a running dashboard update, not a final audited total.

Sources

  • City of Cape Town, Level 6B restrictions and Day Zero projection (30 January 2018) — capetown.gov.za
  • SAnews, Day Zero estimate moves to July as demand falls (20 February 2018) — sanews.gov.za
  • News24, “Four things that helped us push back Day Zero” — news24.com
  • Academic analysis of the Day Zero response (PreventionWeb) — preventionweb.net
  • City of Cape Town Weekly Water Dashboard, 9 November 2026 (PDF) — capetown.gov.za
  • City of Cape Town, dams at 74.9% and the 80% November threshold (1 July 2026) — capetown.gov.za
  • City of Cape Town, dams at 50.4% (18 March 2026) — capetown.gov.za
  • City of Cape Town Water Outlook, August 2026 — capetown.gov.za

Australia’s New PFAS Guidelines, and Why 70 to 8 Is Not a Like-for-Like Comparison

Australia’s mains water is generally well regarded and utilities publish their monitoring data. That is exactly why the interesting story is not “is it safe” but “where the guidelines just moved, and what one utility had to build when they did”.

In 2025 the PFAS numbers changed sharply. Understanding how they changed — and one live case in New South Wales — is more useful than any general claim about Australian tap water.

One clarification that most coverage skips: the old 70 ng/L figure was a combined limit for PFOS and PFHxS; the new 8 ng/L figure applies to PFOS alone. They are not the same measurement, so “ten times tighter” is not a like-for-like comparison. Where the two are directly comparable — PFOA — the value went from 560 to 200 ng/L, about 2.8 times tighter.

Bar chart of PFAS guideline values: PFOA 560 to 200 ng/L, and PFOS plus PFHxS combined 70 ng/L versus PFOS alone 8 ng/L
Australian PFAS guideline values, 2018 versus June 2025. Note that the 2018 figure is a combined PFOS+PFHxS limit. Source: NHMRC ADWG via Senate inquiry, Chapter 7.

The guideline change

The NHMRC’s updated Australian Drinking Water Guidelines, published in June 2025, set health-based values of PFOA 200 ng/L, PFOS 8 ng/L, PFHxS 30 ng/L and PFBS 1,000 ng/L. The 2018 figures were PFOA 560 ng/L and a combined PFOS + PFHxS limit of 70 ng/L.

The PFOS number moved during consultation: NHMRC initially proposed 4 ng/L and settled on 8 ng/L, after commissioning a critical appraisal of benchmark models — including the US EPA’s — and favouring a “Gamma model”. A witness before a Senate committee described even 8 ng/L as close to a tenfold reduction on the 2018 guideline.

For a household, the practical reading is that the guidance moved toward precaution, not that your water suddenly became worse. These are national guidelines — “should not exceed” values — which each state puts into practice through its own regulation. They are not self-executing legal limits.

The Blue Mountains case, in detail

Sydney Water states that in August 2024 the Medlow and Greaves Creek dams were identified as having elevated PFAS and were isolated from supply. In December 2024 it commissioned a $3.4 million PFAS treatment system at the Cascade Water Filtration Plant using granular activated carbon plus ion exchange resin, with a ten-year design life.

As of its October 2026 update, the two dams remain disconnected and Cascade water continues to meet the ADWG PFAS values.

Two things are worth taking from that. First, the technology that actually works at utility scale for PFAS is GAC and ion exchange — not a A$30 jug filter. Second, the system was commissioned about four months after the dams were identified — which tells you how much treatment capacity matters relative to filtration at home.

The inquiry was not kind to the utility

The NSW Legislative Council select committee tabled its report on 11 September 2025 with 16 findings and 32 recommendations. Finding 1 is that Sydney Water did not perform “an appropriate level of due diligence” before claiming in June 2024 that there were no known PFAS hotspots in its drinking-water catchments. It also recommended PFAS blood testing for willing exposed community members.

The committee’s second finding concerns NSW Health expert advice. Separately from the committee, the International Agency for Research on Cancer classifies PFOA as carcinogenic to humans — worth knowing, but that is IARC’s assessment, not the committee’s.

Boil-water notices do happen

North East Water issued a precautionary boil-water advisory on 23 December 2025 for Wodonga and surrounding towns — Bandiana, Baranduda, Barnawartha, Bonegilla, Chiltern, Ebden, Kiewa, Killara, Leneva, Springhurst, Tangambalanga and the Logic Centre — after rainwater was believed to have entered a treated water storage tank during heavy rain. It was lifted on 24 December after network testing.

One day, one storm, a dozen towns and an industrial site. If you keep a filter for emergencies, this is the scenario it is actually for.

Water security, unevenly

Melbourne’s storages were 69.3% on 1 September 2026 — up 5.9% over winter, but 3.1% lower than a year earlier and more than 20% lower than two years earlier. Melbourne Water ordered 150 billion litres from the Victorian Desalination Plant for 2026/27 and states water restrictions are possible over summer 2026/27.

Elsewhere the picture is different: South East Queensland’s Water Grid storage was 81.8% at 30 September 2025 — well above the level at which drought response measures would begin, which is the opposite end of the spectrum from Melbourne.

Lower storages do not mean unsafe water. They shift source mix — more desalinated or more groundwater — which is typically a taste and hardness story rather than a health one. If your kettle scales faster in a dry year, that is why.

What household filtration is actually for in Australia

Australian utilities meet the ADWG at the plant. Filtration at home addresses the last metres and the last few percent:

  • Old plumbing. Lead from pre-1980s solder and brass fittings is a real, localised risk that no national dataset measures.
  • Taste and odour. Chlorine and chloramine, especially after a source switch or a main repair.
  • Hardness and scale. Kettle scale, shower glass, appliance life. A salt-free conditioner changes how scale behaves; it does not soften water in the ion-exchange sense, and it does not remove contaminants.
  • PFAS reassurance. If this is your concern, it needs a system with a certified PFAS reduction claim — typically reverse osmosis or a dedicated carbon/IX stage — and you should check the certification against the certifier’s public listing rather than the product page. A standard carbon jug filter is not a PFAS solution.

Under-sink systems · Shower filters · Whole house systems

Sources

  • NHMRC, updated Australian Drinking Water Guidelines (June 2025) — nhmrc.gov.au
  • Senate PFAS inquiry, Chapter 7 (guideline values and table 7.1) — aph.gov.au
  • Sydney Water, PFAS treatment at Cascade Water Filtration Plant (October 2026 update) — sydneywater.com.au (PDF)
  • NSW Legislative Council select committee report media release (11 September 2025) — parliament.nsw.gov.au (PDF)
  • North East Water, Wodonga boil-water advisory — nerwa.vic.gov.au
  • Melbourne Water, Water Outlook (storage and desalination) — melbournewater.com.au
  • Seqwater water security update, September 2025 (PDF) — seqwater.com.au
  • IARC classification of PFOA (independent of the NSW committee) — iarc.who.int

Hard Water in Australia Is a Postcode Problem, Not a City One

“Is the water hard here?” is the most common water question in Australia, and the answer is usually given at the wrong scale. Hardness is not a city property. It varies by supply zone within a single metro, sometimes by a factor of eight.

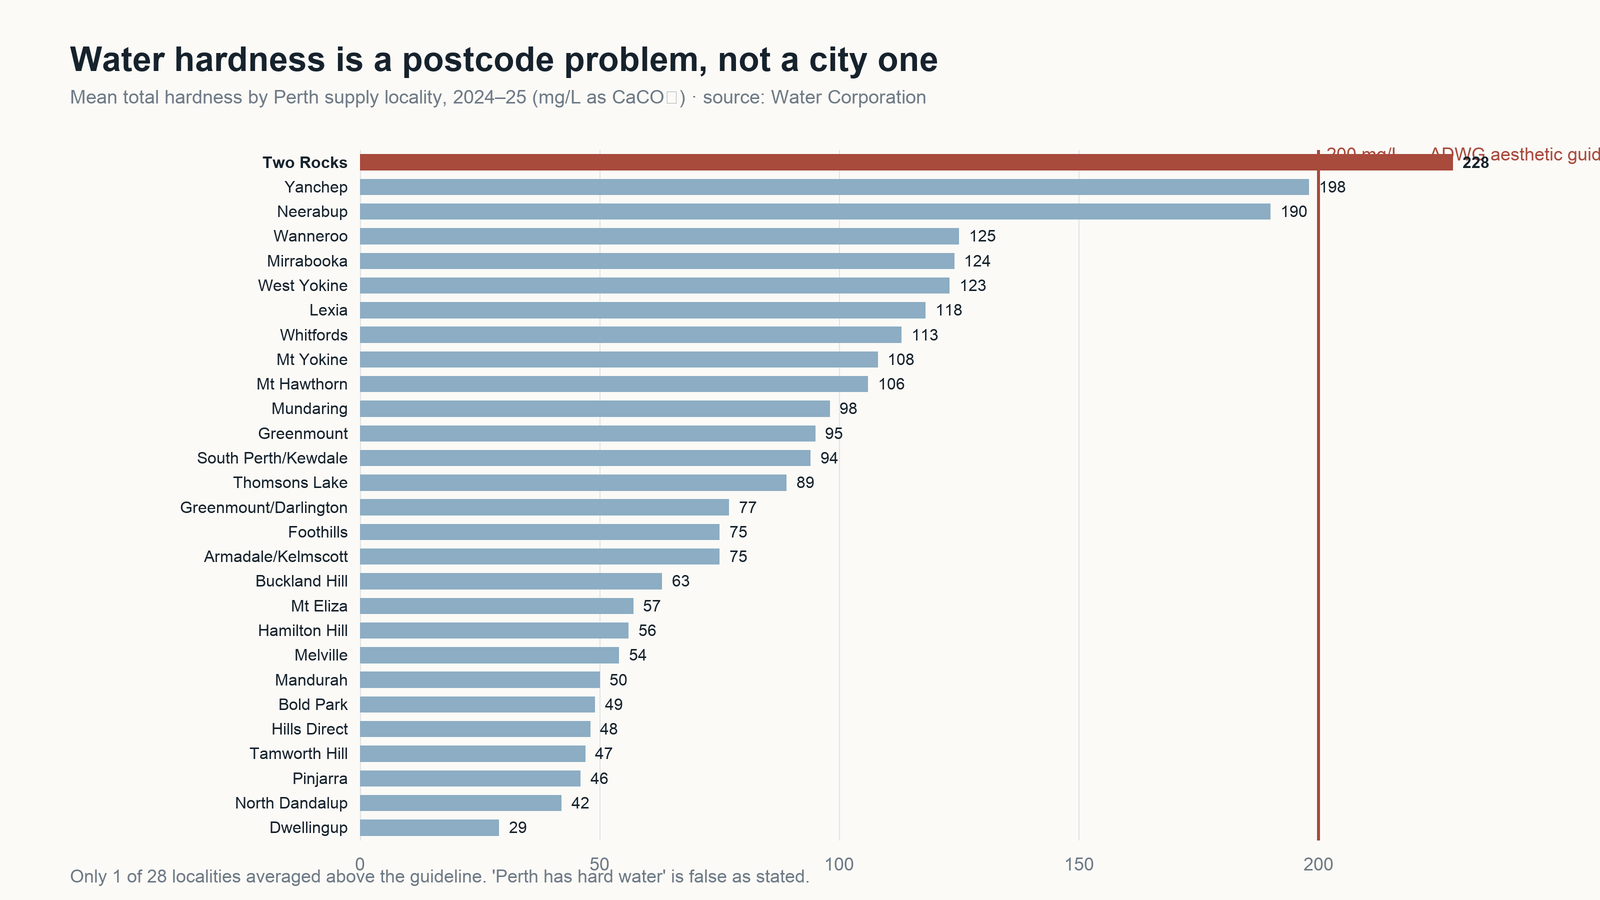
The national guideline makes the practical stakes clear. To minimise scale build-up in hot water systems, total hardness should not exceed 200 mg/L — and above that level, the guidelines warn of “excessive scaling of pipes and fittings” and “blockage of safety relief valves in hot water systems”.

Horizontal bar chart of mean total hardness for 28 Perth supply localities, from 29 mg/L at Dwellingup to 228 mg/L at Two Rocks, with the 200 mg/L guideline marked
Mean total hardness by Perth supply locality, 2024–25, against the 200 mg/L aesthetic guideline. Source: Water Corporation, Drinking Water Quality Annual Report 2024–25, Table 4.

What the guideline actually says

Hardness is classified as an aesthetic parameter, not a health one. The ADWG bands are: below 60 mg/L, “soft but possibly corrosive”; 60–200 mg/L, “good quality”; 200–500 mg/L, “increasing scaling problems”; above 500 mg/L, “severe scaling”.

That first band is worth sitting with. The same guidance notes that soft water may lead to greater corrosion of pipes, depending on pH, alkalinity and dissolved oxygen — so low hardness is not automatically “better”, it moves the problem from scale to corrosion.

Nationally, hardness in major reticulated supplies ranges from about 5 mg/L to about 380 mg/L.

The Perth data, locality by locality

Water Corporation publishes annual means for 28 Perth supply localities. In 2024–25 they ran from 29 mg/L at Dwellingup and 42 mg/L at North Dandalup up to 228 mg/L at Two Rocks — the only locality to average above the guideline, with samples between 220 and 240 mg/L. The utility footnotes it plainly: “Elevated hardness is characteristic of the source supplying this locality.”

Yanchep (198 mg/L) and Neerabup (190 mg/L) sat just under the line. Most of the metro was far lower: Mandurah 50, Bold Park 49, Tamworth Hill 47, Pinjarra 46.

So “Perth has hard water” is false as stated. Hardness is a supply-zone issue, and the fix is knowing your zone.

Why the spread exists

Perth’s Integrated Water Supply Scheme in 2024–25 was 41.5% desalinated seawater, 43.6% groundwater and 13.8% surface water. Groundwater is where the minerals come from, and the utility operates crystallisation softening at the Neerabup groundwater treatment plant specifically to reduce hardness — which is why Neerabup’s delivered water sits at 190 mg/L rather than higher.

Source mix is therefore also why hardness changes over time. As the mix shifts, so does your kettle.

The other end of the country

Sydney Water reports per delivery system rather than citywide, which is the honest way to do it. For the Ryde system in 2025–26 the annual average total hardness was 52.5 mg/L across 28 samples, with a typical range of 46–58 mg/L, well under the 200 mg/L guideline and compliant.

Ryde is not “Sydney” — quoting it as a city figure would repeat the same error in the other direction.

What households actually notice

The utility’s own consumer framing: hard water “requires more soap to obtain lather and can also cause scale to form on hot water pipes and fittings”, and “can also be an important issue to consider when purchasing appliances, such as dishwashers”.

Practically: kettle scale, shower glass, and hot-water system efficiency are the visible costs. A salt-free descaler changes how scale behaves rather than removing minerals; a conventional ion-exchange softener actually removes calcium and magnesium but needs salt and maintenance. They are different products and should not be sold as interchangeable.

Shower filters · Whole house systems

Reading note: “hard” is not a standardised word across jurisdictions, so figures here are quoted in mg/L rather than adjectives. We could not verify primary utility figures for Adelaide or Melbourne and have therefore not printed them. And where a single city quote appears, it refers to one delivery system, not the whole city.

Sources

  • NHMRC, Australian Drinking Water Guidelines — Hardness (aesthetic) fact sheet — guidelines.nhmrc.gov.au
  • Water Corporation, Drinking Water Quality Annual Report 2024–25 (PDF, Table 4 p.61; source mix p.16; softening p.29) — watercorporation.com.au
  • Sydney Water, Quarterly Drinking Water Quality Report — Ryde Delivery System, Q4 FY2025-26 (PDF) — sydneywater.com.au

Is Bali’s Tap Water Safe? What the Utility’s Own Numbers Say

Bali’s tap water is one of those questions where almost everyone has an answer and almost nobody has a source. The municipality of Denpasar publishes a 459-page water master plan containing the actual figures. It is in Indonesian, it is not indexed in English, and it is more candid than any blog post on the island.

Read together, its numbers say something specific: the utility claims the water is drinkable, and simultaneously reports that about 17% of customers do not receive optimal quality.

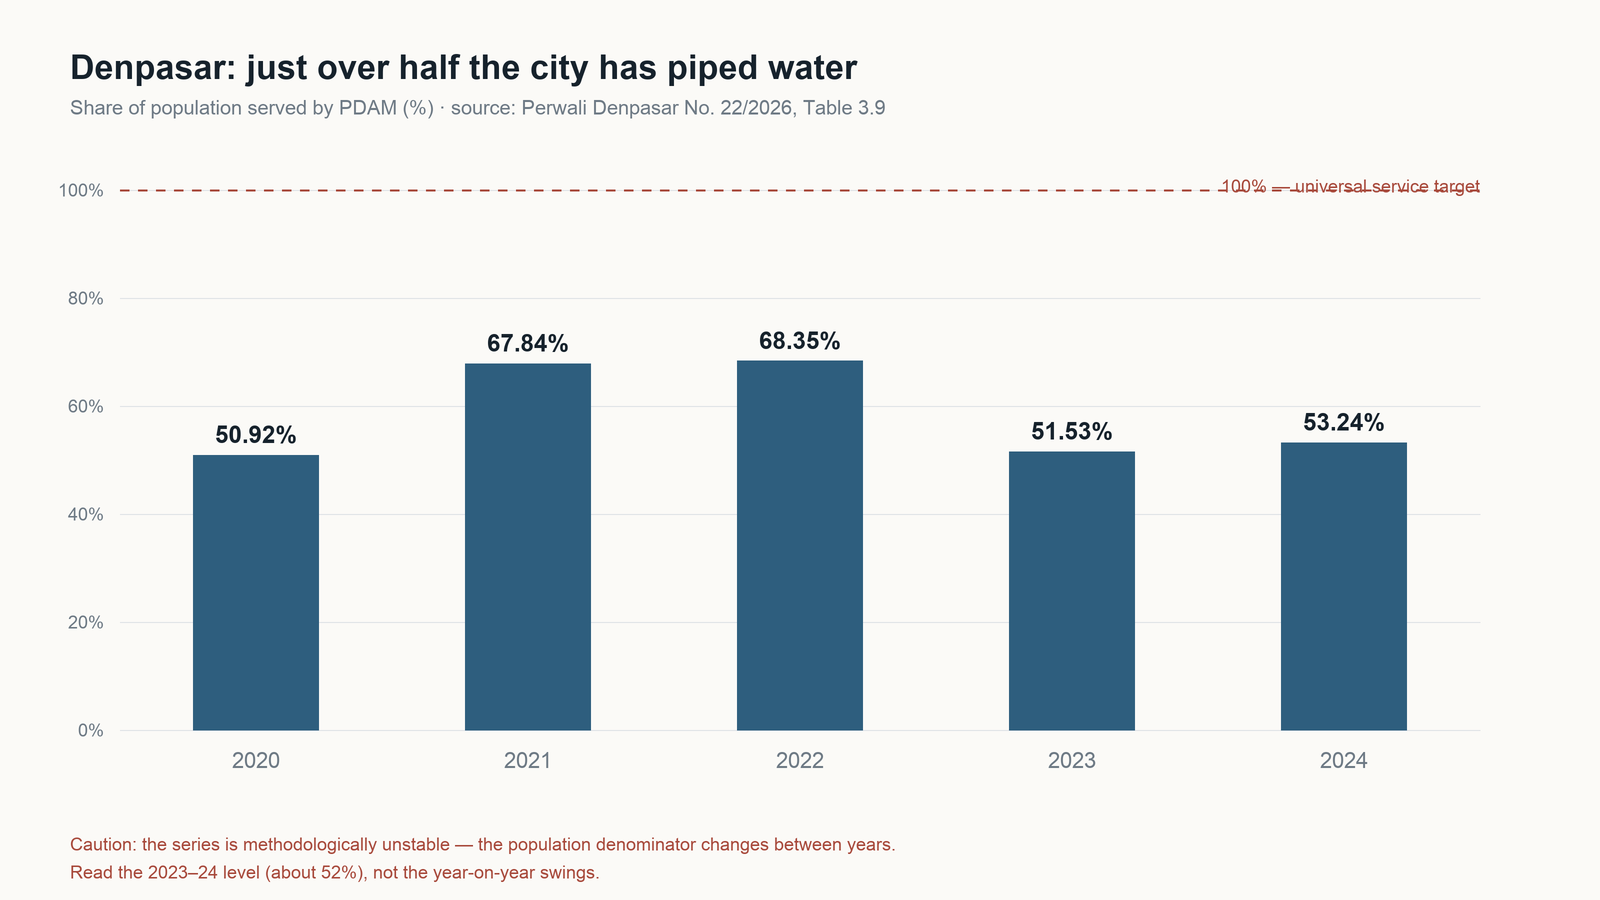
Bar chart of Denpasar piped water coverage from 2020 to 2024, around 51 to 53 percent in the most recent years, with a 100 percent target line
Share of Denpasar’s population served by the piped network. Source: Perwali Denpasar No. 22/2026, Table 3.9.

Roughly half the city is not on the pipe

Denpasar’s piped network served 53.24% of the population in 2024 (51.53% in 2023), across 91,605 active connections. The same document estimates that 40–50% of residents meet their drinking-water needs outside the piped network — dug wells, boreholes, bottled water and refill water — and describes that consumption as “relatively high”.

This is the context that no bottled-water advertisement mentions: most of Denpasar is not drinking municipal water at all.

The utility’s own quality figure is 82.79%

Assessed against Indonesia’s drinking-water standard, Permenkes 2/2023, the utility’s 2023 performance report puts customer water quality at 82.79%. The document then concedes that “there remain around 17% of customers who do not yet receive optimal water quality, whether in terms of clarity, colour, taste or pressure.”

That is the single most useful sentence in the whole plan — and it is a compliance figure across all parameters, not a contamination rate. It should not be read as “17% of taps have bacteria”.

But it does legally claim potability

On the strength of 3,536 samples in 2024, with residual chlorine at a maximum of 1 mg/L at the reservoir and still above the 0.2 mg/L minimum at the furthest distribution point, the utility concludes the water “can be categorised as drinking water fit for public consumption”.

Both statements are true at once. The standard it is measured against is strict on paper — E. coli 0 CFU/100 mL, total coliform 0, TDS under 300 mg/L — and the utility’s own compliance rate against it is 82.79%.

The statistic that hides the problem

Indonesia’s statistics agency reports that 98.32% of Bali households have “access to a safe drinking water source” — the second-highest province nationally. That indicator counts bottled water, refill water and protected springs as “safe”. The gap between 98% and roughly half the city having a pipe is the whole story.

What service actually looks like

Coverage is not the same as service. In Uluwatu, connected households report that “on a good day, water moves through the pipes for an hour”, with residents leaving taps open to hear when it arrives.

Non-revenue water in Denpasar was 34.52% in June 2025 and 35.96% in 2023, against a Ministry ceiling of 25% — 34,965,595 m³ produced against 23,022,996 m³ sold in 2024. The plan blames ageing pipes, broken meters and unstable pressure.

When pipes fail, tankers substitute at a multiple of the pipe tariff: around Rp70,000 per m³ in Uluwatu against Rp1,780 for the first 10 m³ of household PDAM water — roughly forty times the unit price.

What hotels do, and what it tells you

ITDC began operating a sea-water reverse-osmosis plant for The Nusa Dua in January 2026, with a ministry permit, to secure supply for its hotels and villas. Meanwhile PDAM Badung’s own desalination plan is still in feasibility study, and its director is blunt about why: the output is drinking-grade but the network is too old to receive it — “that is not viable” — with only 30–40% usable as drinking water and costs described as very high.

That is a verdict on pipes, not on seawater.

So what should a household or villa do?

Assuming municipal water is drinkable is a claim the utility makes and partly meets. Treating it as reliably optimal is not supported by its own 82.79%. The practical layering is:

  • Sediment and carbon at the point of entry for the clarity, colour and taste complaints the utility itself lists — and for the sediment that intermittent pressure pushes into lines.
  • Reverse osmosis at the kitchen if you want drinking water independent of pipe quality. In coastal areas this is not optional: see our companion piece on salt intrusion, where wells measured 10,000–20,000 mg/L.
  • Water storage if supply is an hour a day, with a cleaning schedule — a tank left alone becomes its own problem.

Under-sink systems · Whole house systems · Cartridges

Reading notes: the coverage series in the master plan is methodologically unstable — the population denominator changes between years — so we quote the 2023–24 level rather than year-on-year swings. We could not verify a current province-wide piped coverage figure; published numbers conflict badly, so we have not printed one. And the 82.79% figure is a quality-compliance rate, not a contamination rate.

Sources

  • Peraturan Walikota Denpasar No. 22/2026 (water master plan; coverage Table 3.9, NRW, tariff schedules, quality compliance) — peraturan.bpk.go.id (PDF)
  • Permenkes No. 2/2023 drinking-water parameters (E. coli 0, coliform 0, TDS <300 mg/L) — labkesda.surakarta.go.id
  • BPS 2024 household access to a safe drinking-water source — databoks.katadata.co.id
  • The Guardian on Uluwatu supply and tanker prices (14 July 2026) — theguardian.com
  • ITDC sea-water RO plant for The Nusa Dua (January 2026) — bali.jpnn.com
  • BaliPost on PDAM Badung’s SWRO feasibility findings (17 November 2025) — balipost.com
  • NusaBali on tanker water prices in Karangasem — nusabali.com

Is Bali Sinking? What the Subsidence Data Does and Doesn’t Show

“Bali is sinking” is one of the most repeated claims about the island. It is also one where the honest answer is more interesting than the slogan: there is measured subsidence, the measurements disagree with each other by a factor of eight, and the study that measured it explicitly says the cause cannot be determined.

Meanwhile the better-evidenced problem is not sinking at all. It is salt.

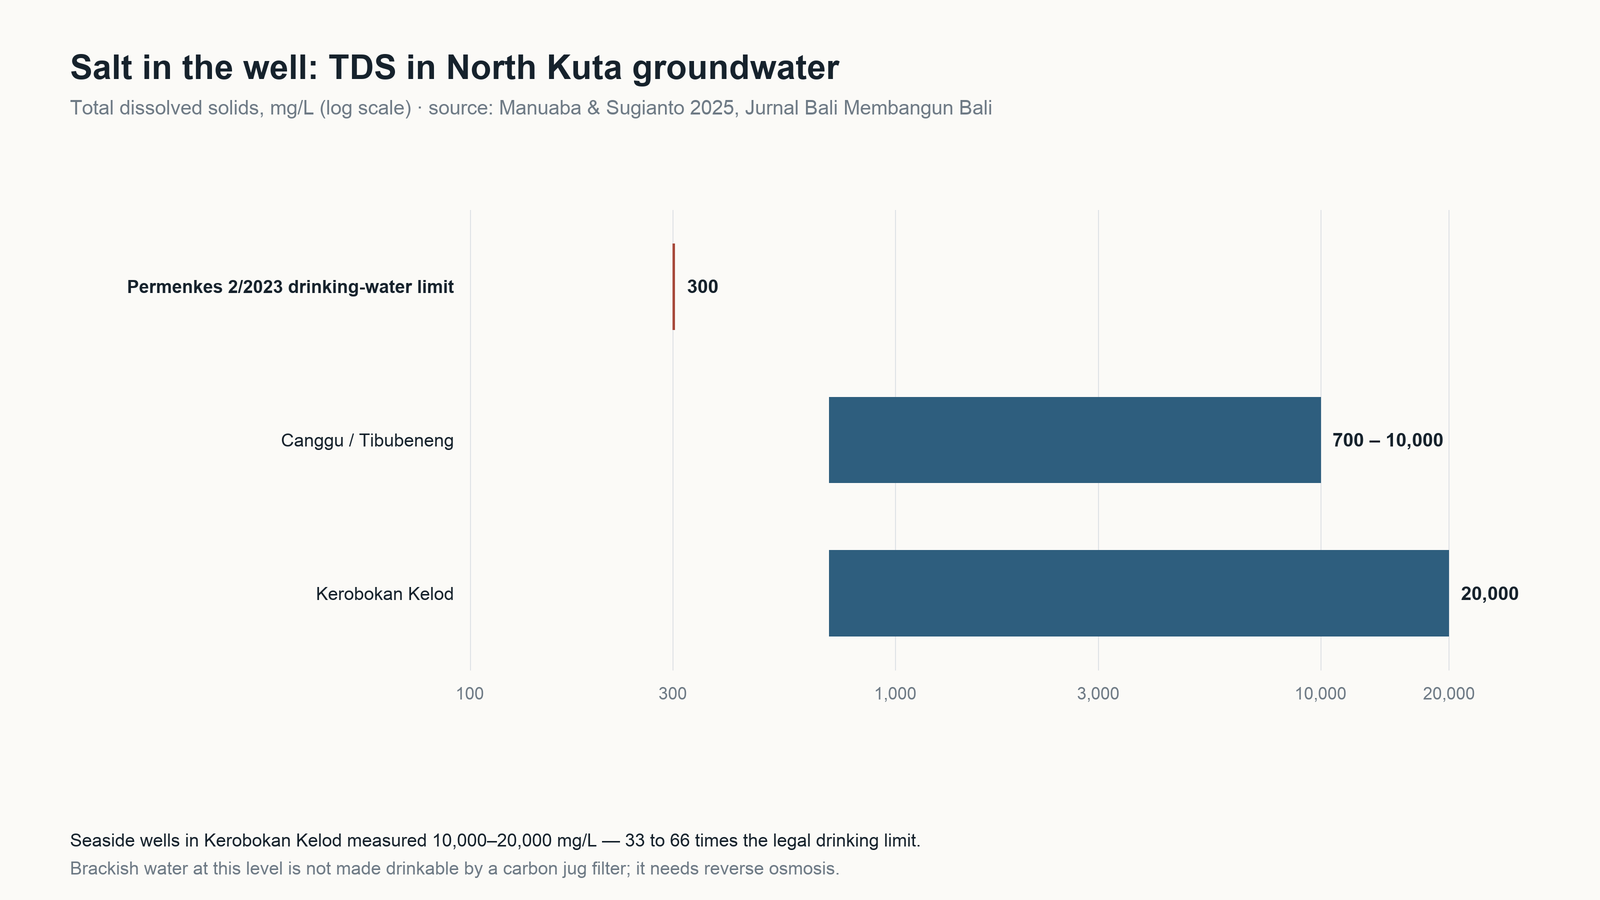
Log-scale bar chart comparing measured total dissolved solids in North Kuta wells, 700 to 20,000 mg/L, against the 300 mg/L drinking-water limit
Measured TDS in North Kuta groundwater against the Permenkes 2/2023 drinking-water limit of 300 mg/L. Source: Manuaba & Sugianto 2025, Jurnal Bali Membangun Bali.

What the subsidence data actually shows

A 2025 peer-reviewed study using Sentinel-1 radar (2014–2022) reports “typical rates of −10 to −60 mm/yr, local extremes near −70 mm/yr” across southern Bali, with hotspots at Padang Sambian, Dauh Puri, Sanur, Pemogan and Dalung, and field evidence of wall cracking, floor settlement and road depressions.

The same paper undercuts the simple story. It finds Canggu shows no detectable subsidence, and the correlation between subsidence and built-up density is essentially zero (r between −0.11 and +0.008). The authors conclude that “unrevealed factors remain a key concern” and that they cannot determine the primary causes.

There is also an internal inconsistency worth knowing about. The paper’s table lists interannual means of +10, +12 and +17 mm/yr — apparent uplift — for 2015–16, 2016–17 and 2017–18, while its 2014–2022 row reads a minimum of −65, mean −38 and maximum 0.001. Those are the signature of cumulative millimetres over eight years, not mm/yr. Read that way the mean is roughly −4.8 mm/yr, which is consistent with the earlier, more conservative study.

That earlier work (PS-InSAR, southern Bali, 2015–2018) found cumulative movement of −8 to −19 mm and a maximum velocity of about −5 mm/yr.

Scale check

Jakarta, the city everyone is actually thinking of, subsides at 1–15 cm/yr (1982–2010) and about −10.96 cm/yr in 2017–2022. Bali’s figures are millimetres per year — roughly an order of magnitude smaller, and far more localised.

So: localised subsidence, contested magnitude, unresolved cause. Not “Bali is sinking”.

Salt is the clearer problem

A 2025 geoelectric survey in North Kuta measured well water directly. At Kerobokan Kelod, resistivity below 4.5 Ω·m and TDS of 10,000–20,000 mg/L; seawater intrusion extended 1,200 m along the coast and 700 m inland. At Canggu and Tibubeneng, TDS ran 700–10,000 mg/L. The authors project inland advance of 35–56 m per year to 2029.

Against the 300 mg/L drinking-water limit, Kerobokan Kelod’s wells are 33 to 66 times over. This is not a taste issue. Brackish water at that level is not made drinkable by a carbon jug — it requires reverse osmosis.

Why it is happening

Because drilling is rational. Bali’s energy and mining office has said the province would not rush restrictions while surface-water infrastructure is not ready, noting that the groundwater tax is lighter than the PDAM alternative — the operator clusters being permitted-and-taxed, unpermitted-but-taxed, and neither.

Meanwhile the recharge infrastructure is being paved. More than 6,500 hectares of rice fields were lost in five years, a decline of over 9%, and in Canggu farmland fell 60% while land under development rose 69%.

The legal architecture changed in 2024: Permen ESDM 14/2024 abolished the old drilling permits in favour of SIPA (five-year business) or a non-business groundwater approval. Enforcement is now a central-government function; the province told the Guardian that inspections had sat with Jakarta for five years and declined to give a figure for licensed groundwater businesses.

Why 2025 made it mainstream

September 2025 floods killed 17 people and caused Rp28.9 billion in damage across Denpasar and six of eight regencies. Land conversion in Tabanan, Badung, Gianyar and Denpasar was running at 3–6% per year, 2018–2023. The governor subsequently announced a ban on new hotels, restaurants and commercial facilities on productive land.

What this means for a household or villa

If you are on a well in the south — Kuta Utara, Kuta, Kuta Selatan, Sanur, Pemogan — test for salinity before buying any filter. TDS is cheap to measure and it decides the category. Above a few hundred mg/L, sediment and carbon do nothing for you; you need reverse osmosis, and a whole-house RO is a very different (and more expensive) system than a carbon stage.

If you are on PDAM supply, see our companion article on what the utility’s own numbers say.

Under-sink RO · Whole house systems · Water test kits

Claims we deliberately did not use: “Bali is sinking” (no consistent rate), “tourism consumes 65% of Bali’s fresh water” (traces to a 2012 political-ecology paper, not a water balance), and any figure for the province-wide piped coverage (published numbers conflict and we could not verify one). We also found no official count of unpermitted wells, so we have not cited one.

Sources

Boiling Won’t Fix It: What 2.1 Billion People Without Safe Water Means for Travellers

If you live somewhere the tap water is reliably safe, it is easy to assume that “water safety” is a solved problem with a few exceptions. The numbers say otherwise: about one person in four does not have drinking water that is on-premises, available when needed, and free from contamination.

This matters more than ever to people who move between countries — remote workers, expats, long-stay travellers, and anyone running a household in Southeast Asia, Latin America or sub-Saharan Africa. The useful question is not “is the water safe here” but “which failure mode am I dealing with, and what actually addresses it”.

The baseline

WHO and UNICEF’s Joint Monitoring Programme, 2025 report, with data running to 2024, puts it at 2.1 billion people — one in four — without safely managed drinking water, including 106 million who drink directly from untreated surface water. “Safely managed” is a strict definition: on-premises, available when needed, and free from contamination. Fail any one and you are outside the count.

Sanitation is measured alongside it: 3.4 billion people lack safely managed sanitation, including 354 million practising open defecation. Faecal contamination of source water is a well-established pathway to drinking-water risk, though the two statistics measure different things.

In fragile contexts, safely managed drinking-water coverage is 38 percentage points lower than in other countries, and least-developed countries are more than twice as likely to lack even basic drinking water. Coverage in urban areas has also stagnated, according to the same report.

What failure looks like: cholera

Cholera is the clearest visible signal that a water system has broken down. As of 29 June 2025, the WHO African Region reported 20 countries affected, 144,665 cases and 2,917 deaths — a case fatality rate of 2.0%. Five countries (South Sudan, DRC, Angola, Ethiopia and Mozambique) accounted for 92.3% of cases.

Fatality rates in cholera outbreaks are shaped largely by how quickly people reach treatment — which is a function of the health system around them, not of the pathogen alone.

The money and the leakage

UN-Water’s GLAAS 2025 report, covering 105 countries, found an average financing gap of roughly 46% among countries with comparable data, and non-revenue water close to 40% in some systems — leakage, poor asset management, weak billing.

That figure echoes our South Africa piece, with one important distinction. South Africa’s 47% is non-revenue water — a mix of physical loss and water delivered but never billed — against an international average its regulator puts at about 30%. GLAAS describes close to 40% in some systems, which is a different claim from a global average, and the two should not be blended together.

Cities that ration, and cities that sink

Two recent cases show how fast a capital’s water position can move.

In April 2024, about 10 million residents of Bogotá were put on water rationing with 24-hour cuts every ten days as reservoirs hit record lows — described as the most drastic measure the city had taken in decades.

Mexico City’s main storage system shows how far a capital’s water position can swing. Conagua reported in October 2025 that the Cutzamala system held 97.3% of capacity — 762 million cubic metres — supplying more than 5.5 million people and about 23% of the Valley of Mexico’s water.

The useful lesson is that storage is not the same variable as safety. If you want the specific record-low figures and the “Day Zero” discussion, read them from Conagua’s own reporting rather than a summary — we are only citing what we could verify in the October 2025 release.

The lesson is not “the crisis ended”. It is that storage is not the same variable as safety. A reservoir at 26% and one at 97% can both produce compliant water; what changes is source mix, treatment load, and the taste in your glass.

Jakarta tells a different story — one about pipes. PAM Jaya says coverage rose from just over 60% when it resumed full public control in 2023 to about 82% in 2026, targeting universal piped water by 2029. Excessive groundwater extraction, not sea-level rise, is described as the main cause of subsidence of up to 15 cm per year, with some areas down as much as 4 metres since the 1970s.

Treat the 82% as a utility claim rather than a measured connection rate — the article itself presents it as PAM Jaya’s figure. Where piped water is absent, people drill — and drilling is what sinks the city.

The contaminant travellers miss

Pathogens get all the attention, but some of the most consequential contaminants in the regions above are geological, not faecal.

A peer-reviewed study of northern Argentina found arsenic in drinking water varying from less than 1 to about 200 µg/L, with one source (San Antonio de los Cobres) fluctuating between 140 and 220 µg/L across ten years with no downward trend — against a WHO guideline of 10 µg/L. High groundwater arsenic is documented across the Puna, Chaco, Córdoba and Pampas regions.

Two details make this worth knowing. First, the study was published in 2006, so read it as evidence of a documented regional hazard rather than current concentrations. Second, and more importantly: boiling does not remove arsenic. Boiling kills pathogens and concentrates everything dissolved, because the water leaves as steam and the salts stay. The same is true of nitrate.

A layered approach, rather than a single product

The honest answer for uncertain supply is layering, matched to the failure mode:

  • Sediment — rust, grit, tank debris. Cheapest stage, protects everything after it.
  • Carbon — chlorine, taste, odour, some organics. Does not remove arsenic, nitrate, or make water microbiologically safe.
  • Microbiological treatment — boiling, UV, or a certified hollow-fibre/ceramic element. This is a disinfection problem, and it is separate from filtration.
  • Reverse osmosis — the stage that addresses dissolved contaminants including arsenic and nitrate, where the supply warrants it. It rejects a lot of water and needs pressure, so it suits a fixed installation more than a backpack.
  • Portable treatment — for travel and emergencies, a filter bottle is a pathogen barrier, not a chemical one.

If you are setting up a household somewhere with intermittent or uncertain supply, a whole-house sediment and carbon system plus a drinking-water stage at the kitchen covers most of it, with disinfection handled separately. If you are travelling, a filter bottle covers pathogens and taste but not arsenic — which is exactly the gap most people do not know they have.

Portable & countertop · Under-sink systems · Whole house systems

Sources

  • WHO/UNICEF JMP 2025 summary (2.1 billion without safely managed water) — who.int
  • WHO African Region cholera bulletin, June 2025 — afro.who.int
  • UN-Water GLAAS 2025 summary (financing gap, non-revenue water) — waterdiplomat.org
  • BBC on Bogotá water rationing — bbc.com
  • Conagua on Cutzamala storage, October 2025 — gob.mx/conagua
  • The Diplomat on Jakarta piped water and subsidence — thediplomat.com
  • Peer-reviewed study of arsenic in northern Argentina — pmc.ncbi.nlm.nih.gov