“Bali is sinking” is one of the most repeated claims about the island. It is also one where the honest answer is more interesting than the slogan: there is measured subsidence, the measurements disagree with each other by a factor of eight, and the study that measured it explicitly says the cause cannot be determined.
Meanwhile the better-evidenced problem is not sinking at all. It is salt.
What the subsidence data actually shows
A 2025 peer-reviewed study using Sentinel-1 radar (2014–2022) reports “typical rates of −10 to −60 mm/yr, local extremes near −70 mm/yr” across southern Bali, with hotspots at Padang Sambian, Dauh Puri, Sanur, Pemogan and Dalung, and field evidence of wall cracking, floor settlement and road depressions.
The same paper undercuts the simple story. It finds Canggu shows no detectable subsidence, and the correlation between subsidence and built-up density is essentially zero (r between −0.11 and +0.008). The authors conclude that “unrevealed factors remain a key concern” and that they cannot determine the primary causes.
There is also an internal inconsistency worth knowing about. The paper’s table lists interannual means of +10, +12 and +17 mm/yr — apparent uplift — for 2015–16, 2016–17 and 2017–18, while its 2014–2022 row reads a minimum of −65, mean −38 and maximum 0.001. Those are the signature of cumulative millimetres over eight years, not mm/yr. Read that way the mean is roughly −4.8 mm/yr, which is consistent with the earlier, more conservative study.
That earlier work (PS-InSAR, southern Bali, 2015–2018) found cumulative movement of −8 to −19 mm and a maximum velocity of about −5 mm/yr.
Scale check
Jakarta, the city everyone is actually thinking of, subsides at 1–15 cm/yr (1982–2010) and about −10.96 cm/yr in 2017–2022. Bali’s figures are millimetres per year — roughly an order of magnitude smaller, and far more localised.
So: localised subsidence, contested magnitude, unresolved cause. Not “Bali is sinking”.
Salt is the clearer problem
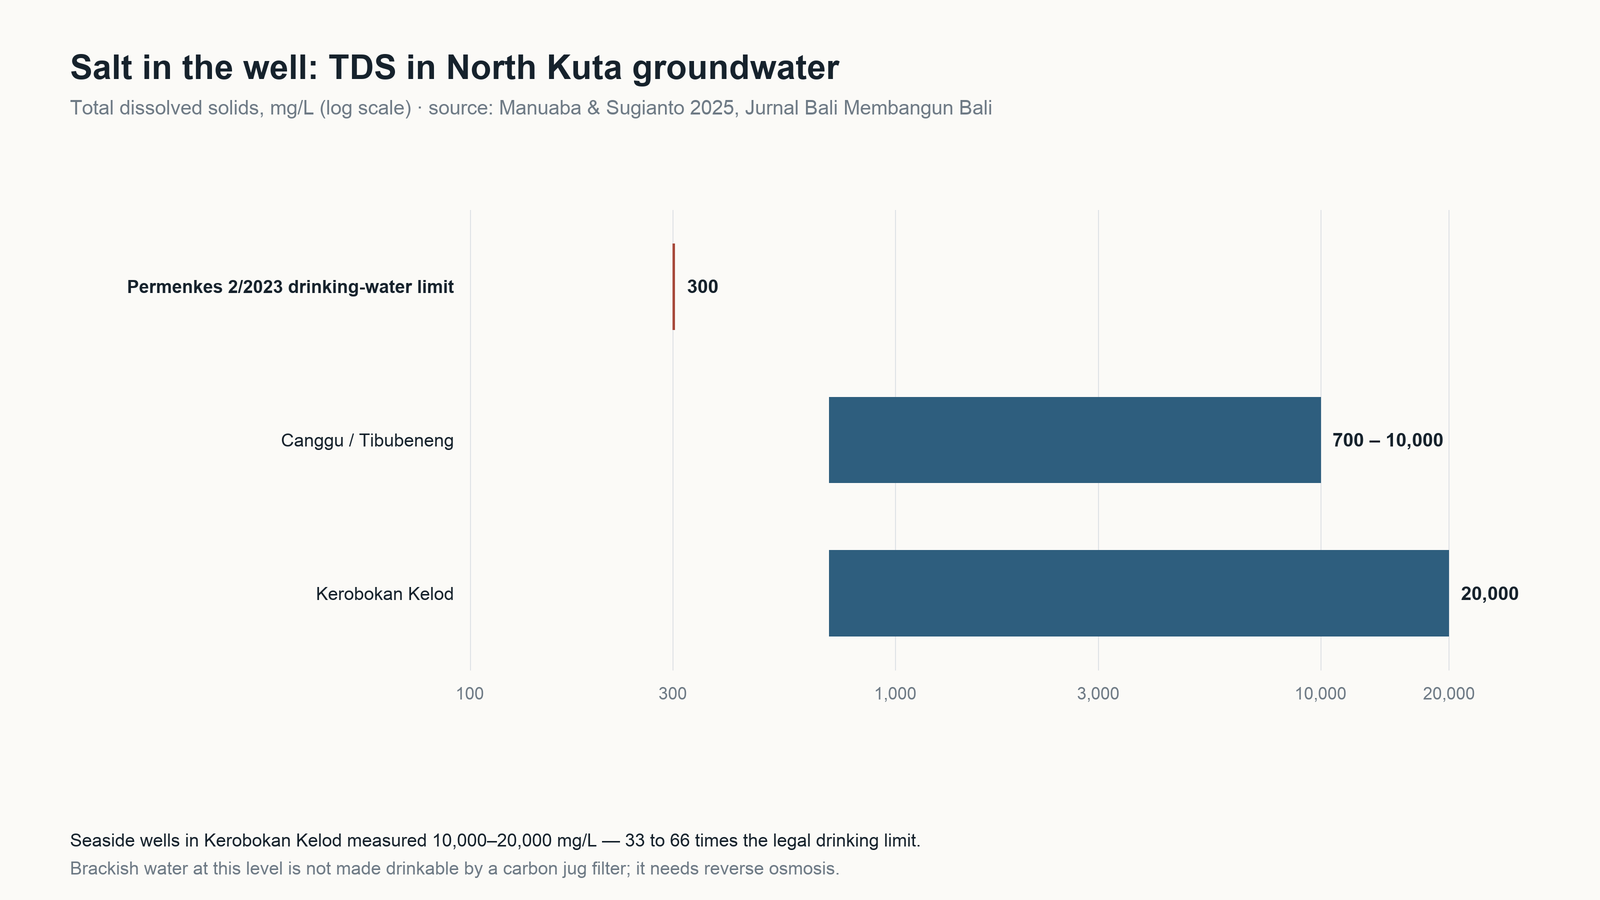
A 2025 geoelectric survey in North Kuta measured well water directly. At Kerobokan Kelod, resistivity below 4.5 Ω·m and TDS of 10,000–20,000 mg/L; seawater intrusion extended 1,200 m along the coast and 700 m inland. At Canggu and Tibubeneng, TDS ran 700–10,000 mg/L. The authors project inland advance of 35–56 m per year to 2029.
Against the 300 mg/L drinking-water limit, Kerobokan Kelod’s wells are 33 to 66 times over. This is not a taste issue. Brackish water at that level is not made drinkable by a carbon jug — it requires reverse osmosis.
Why it is happening
Because drilling is rational. Bali’s energy and mining office has said the province would not rush restrictions while surface-water infrastructure is not ready, noting that the groundwater tax is lighter than the PDAM alternative — the operator clusters being permitted-and-taxed, unpermitted-but-taxed, and neither.
Meanwhile the recharge infrastructure is being paved. More than 6,500 hectares of rice fields were lost in five years, a decline of over 9%, and in Canggu farmland fell 60% while land under development rose 69%.
The legal architecture changed in 2024: Permen ESDM 14/2024 abolished the old drilling permits in favour of SIPA (five-year business) or a non-business groundwater approval. Enforcement is now a central-government function; the province told the Guardian that inspections had sat with Jakarta for five years and declined to give a figure for licensed groundwater businesses.
Why 2025 made it mainstream
September 2025 floods killed 17 people and caused Rp28.9 billion in damage across Denpasar and six of eight regencies. Land conversion in Tabanan, Badung, Gianyar and Denpasar was running at 3–6% per year, 2018–2023. The governor subsequently announced a ban on new hotels, restaurants and commercial facilities on productive land.
What this means for a household or villa
If you are on a well in the south — Kuta Utara, Kuta, Kuta Selatan, Sanur, Pemogan — test for salinity before buying any filter. TDS is cheap to measure and it decides the category. Above a few hundred mg/L, sediment and carbon do nothing for you; you need reverse osmosis, and a whole-house RO is a very different (and more expensive) system than a carbon stage.
If you are on PDAM supply, see our companion article on what the utility’s own numbers say.
Under-sink RO · Whole house systems · Water test kits
Claims we deliberately did not use: “Bali is sinking” (no consistent rate), “tourism consumes 65% of Bali’s fresh water” (traces to a 2012 political-ecology paper, not a water balance), and any figure for the province-wide piped coverage (published numbers conflict and we could not verify one). We also found no official count of unpermitted wells, so we have not cited one.
Sources
- Saifulloh et al. 2025, subsidence from Sentinel-1 InSAR, Ecological Engineering & Environmental Technology 26(9) — ecoeet.com (PDF)
- Dwiputra et al. 2020, PS-InSAR in southern Bali — semanticscholar (PDF)
- Manuaba & Sugianto 2025, seawater intrusion in North Kuta, Jurnal Bali Membangun Bali 6(2) — ejournal.baliprov.go.id
- The Guardian, on rice-field loss, groundwater tax and permitting (14 July 2026) — theguardian.com
- Permen ESDM No. 14/2024 (groundwater permits) — peraturan.bpk.go.id
- ANTARA Bali, on the province’s position on groundwater restrictions — bali.antaranews.com
- Jakarta Post editorial on the September 2025 floods and land conversion — asia-pacific-solidarity.net (reprint)