In early 2018 Cape Town was the first major city in the world to publish a countdown to running out of water. “Day Zero” was a date, it appeared on a website, and it moved. The city never reached it. What is less well known is that the same dashboard, in November 2026, records the metro back in official “Drought Response”.
That is not a rerun of 2018. It is the more ordinary story of a city whose water security now depends on how quickly it builds new supply and how well demand holds.
What actually happened in 2018
On 30 January 2018 the City reported dam levels at 26.3% and projected Day Zero for 16 April 2018. Collective use stood at 580 MLD against a 450 MLD target, and Level 6B restrictions — 50 litres per person per day — took effect on 1 February alongside new tariffs.
By 20 February the projection had moved to 9 July 2018, and weekly average demand had fallen to 523 MLD, against 1,130 MLD in 2014. The city’s own account credits an aggressive roll-out of pressure management and water-management devices at high users’ properties.
The recovery was declared on 7 March 2018, with consumption down from over 600 MLD to about 520 MLD. The premier’s explanation at the time named four things: tighter restrictions, significant tariff increases, a deliberate drop in water pressure, and resident compliance — plus agricultural supply to three irrigation boards being cut entirely and a 10,000-megalitre donation from the Groenland Water Users Association.
Day Zero itself was defined as dams reaching 13.5%, at which point rationing at 25 litres per person per day would begin. It was a moving target by the premier’s own description: 21 April, then 12 April, then 16 April, then 11 May, then 9 July — and then not at all.
The attribution is still contested
Academic analysis of the episode argues that demand management had already cut daily consumption by roughly half since 2016, but that the city consistently failed to get below its 500 MLD target, and that Day Zero was averted “primarily by relying on unexpected buffers” — temporary agricultural transfers and private greywater and boreholes in wealthier neighbourhoods. The authors describe the process as “painful and inequitable”.
Both accounts are sourced and they do not fully agree. That matters for planning: a city that believes it solved 2018 with restrictions and tariffs will invest differently from one that believes it was rescued by luck.
The 2026 position, in numbers
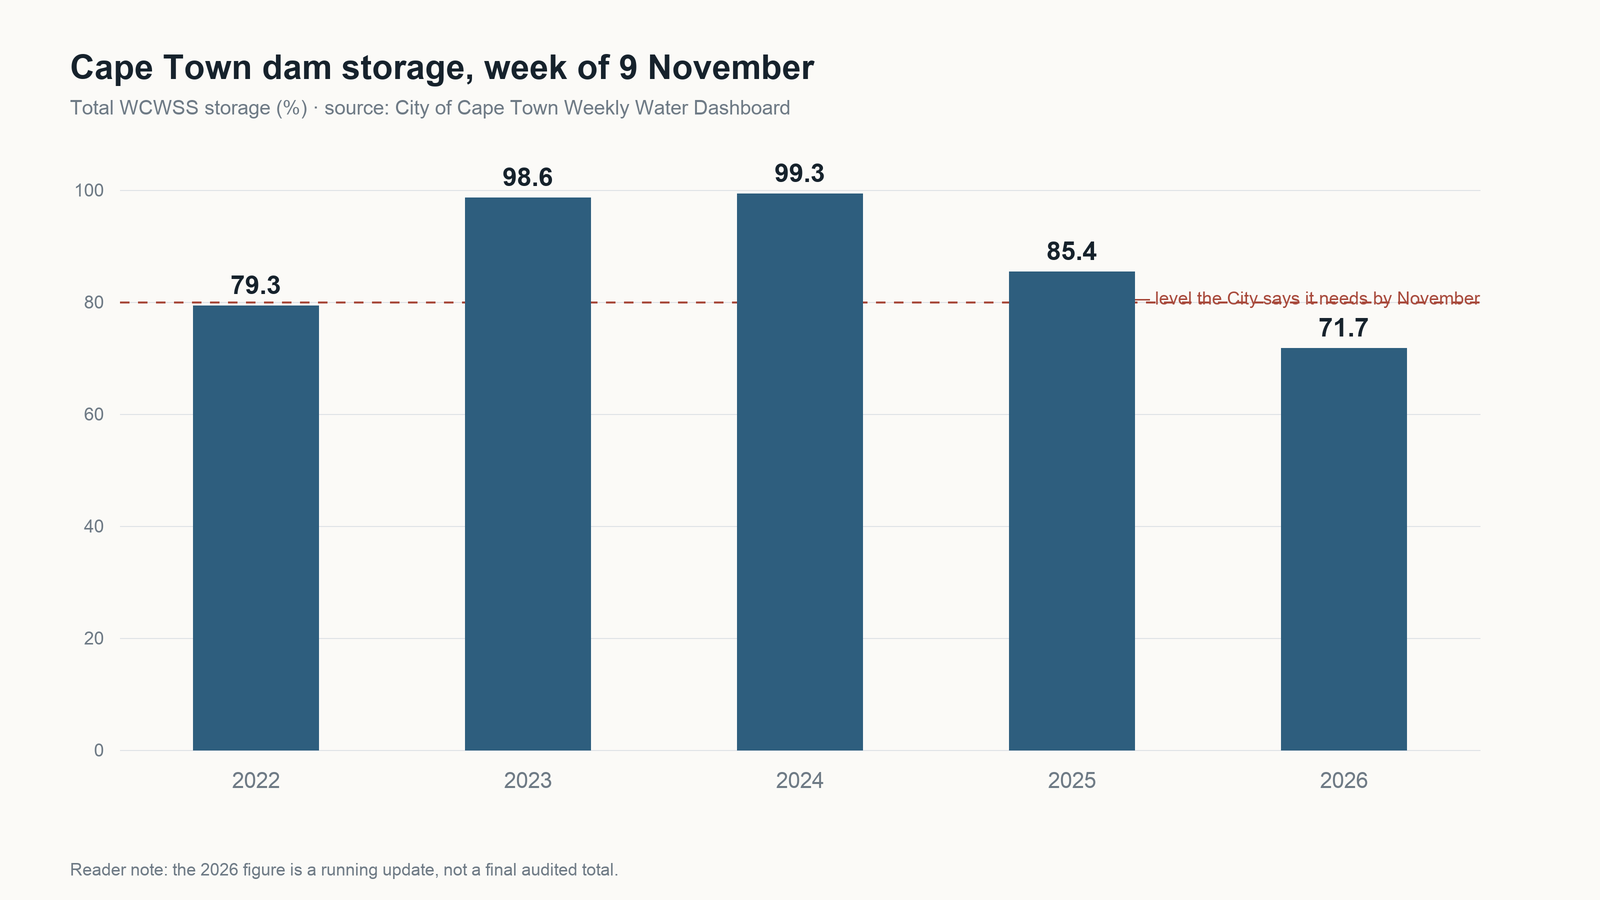
The week of 9 November 2026 put total WCWSS storage at 71.7% — 644,353 Ml of 898,221 Ml capacity — after 85.4% in 2025 and 99.3% in 2024. Rainfall since May has been below expectation, storage is about 15% lower than the same time last year, and the City says it is engaging on “the possible need for formal water restrictions”.
Average total daily use is 880 MLD, at 150 litres per person per day (against a 12-month average of about 160). Production splits as 867 MLD from major dams, 1 MLD from minor dams, and 12 MLD from groundwater and springs.
The swing inside a single year is the striking part. Storage was 79.4% on 3 December 2025; by 18 March 2026 it had fallen to 50.4%, with use at 1,058 MLD — 83 MLD over the 975 MLD target. Then one May storm took storage “from around 44% to above 70% in a matter of days”, and by 1 July 2026 it was 74.9%.
Note the City’s own threshold: dams normally need at least 80% by the November Annual Operating Analysis to avoid restrictions imposed by the Department of Water and Sanitation.
What is being built
The City committed R570 million to its New Water Programme in that financial year, targeting 300 MLD by 2036. The timelines have slipped: Berg River–Voëlvlei (40 MLD) is now 2030, Faure water reuse (70 MLD) first water 2031, Paarden Eiland desalination (70 MLD) 2036, with alien-vegetation clearing worth about 30 MLD.
Its August 2026 outlook notes that demand growth exceeded the 1.5% target in 2025/26, which raises restriction risk.
What this means for a household
A system under this kind of stress produces two water-quality symptoms more than any other: sediment when pressure management and intermittent supply disturb the network, and taste and odour when the source mix shifts. A whole-house sediment and carbon stage handles both. If restrictions return, storage tanks become relevant — and stored water needs its own hygiene plan, not just a tank.
Whole house systems · Replacement cartridges
Two reading notes. The “drought or not” question is genuinely contested: the City said on 18 March 2026 that “Cape Town is not in a drought” while its dashboard used “early drought caution” in October 2025 and “Drought Response” in November 2026. And the 2026 figure is a running dashboard update, not a final audited total.
Sources
- City of Cape Town, Level 6B restrictions and Day Zero projection (30 January 2018) — capetown.gov.za
- SAnews, Day Zero estimate moves to July as demand falls (20 February 2018) — sanews.gov.za
- News24, “Four things that helped us push back Day Zero” — news24.com
- Academic analysis of the Day Zero response (PreventionWeb) — preventionweb.net
- City of Cape Town Weekly Water Dashboard, 9 November 2026 (PDF) — capetown.gov.za
- City of Cape Town, dams at 74.9% and the 80% November threshold (1 July 2026) — capetown.gov.za
- City of Cape Town, dams at 50.4% (18 March 2026) — capetown.gov.za
- City of Cape Town Water Outlook, August 2026 — capetown.gov.za